Is a term I’ve been using for years; I originally learned it from a consultant I worked with at Readify years ago.
Back then we were working a lot on .NET, and Visual Studio was the go-to IDE. In Visual Studio, the button you press to debug was “F5”. So we used to ask the question:
“Can we git clone, and then just press F5 (Debug), and the application works locally?”
And also:
“What happens after this? Is it fast?”
So there are 2 parts to the F5 Experience really:
- Setup (is it Zero)
- Debug (is it fast)
Let’s start with the second part of the problem statement and what work we’ve done there.
Is it fast to build?
This is the first question we asked, so let’s measure compile time locally.
We’ve had devs report that things are slow, but it’s hard to know anecdotally because you don’t know in practice how often people need to clean build vs. incremental build vs. hot reload, and this can make a big difference.
For example, if you measure the three, and just for example’s sake they measure:
- Clean: 25 minutes
- Incremental: 30 seconds
- Hot reload: 1 second
You might think, this is fine because it’s highly unlikely people need to clean build, right?
Wrong. The first step in troubleshooting any compilation error is “clean build it”, then try something else. Also, updates in dependencies can cause invalidation of cache and recalculations and re-downloading of some dependencies. With some package managers, this can take a long time. On top of this, you have your IDE reindexing, which can take a long time in some languages too. I still have bad memories about seeing IntelliJ having a 2 hr+ in-progress counter for some of our larger Scala projects years ago.

So you need to measure these to understand what the experience is actually like; otherwise, it’s just subjective opinions and guesswork. And if it is serious, solving this can have big impacts on velocity, especially if you have a large number of engineers working on a project.
How do we do this?
Most compilers have an ability to add plugins or something of the sort to enable this. We created a series of libraries for this. Here are the open-source ones for .NET and webpack/vite:
I’ll use the .NET one as an example because it’s our most mature one for backend, then go into what differences we have on client-side systems like webpack and vite later in another post.
So after adding this, we now have data in Hadoop for local compilation time for our projects.
And it was “amazing”; even for our legacy projects, it was showing 20-30 seconds, which I couldn’t believe. So I went to talk to one of our engineers and sat down and asked him:
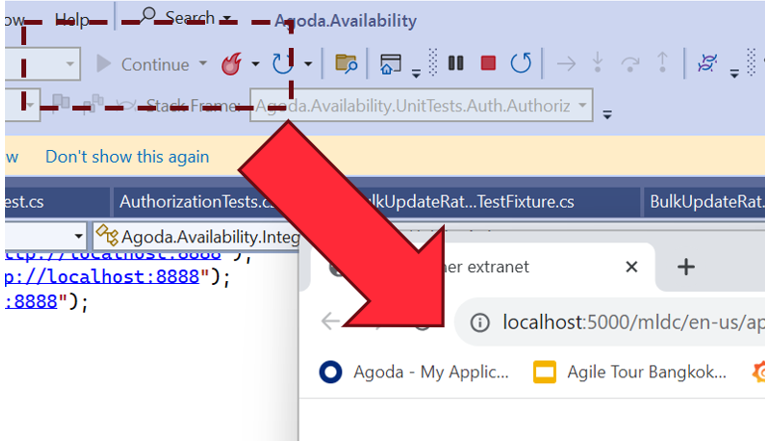
“From when you push debug in your IDE to when the browser pops up and you can check your changes, does it take 20-30 seconds?”
He laughed.
He said it’s at least 4-5 minutes.
So we dug in a bit more. .NET has really good compilation time if you have a well-laid-out and small project structure, and this is what we were reporting. After it’s finished compiling the code though, it has to start the web server, and sometimes this takes time, especially if you have a large monolithic application that is optimized for production. In production, we do things like prewarm cache with large amounts of data. In his case, there wasn’t any mocking or optimizations done for local; it just connects to a QA server that, while having less data than production, still has enough that it impacts it in a huge way. On top of this, add remote/hybrid work, when you are downloading this over a VPN, and boom! Your startup time goes through the roof.
So what can we do? Measure this too, of course.
Let’s look a little bit at the web server lifecycle in .NET though (it’s pretty similar in other platforms):

The thread will hang on app.Run() until the web server stops; however, the web server itself has lifecycle hooks we can use. In .NET’s case, HostApplicationLifetime has an OnStarted event. So we can handle this.
However, the web browser may have “popped up,” but the page is still loading. This is because if you don’t initialize the DI dependencies of an HTTP controller before app.Run(), it will the first time the page is accessed.
So we need another measurement to complete the loop, which is:
“The time of first HTTP Request completion after startup”
This will give us the full loop of “Press F5 (Debug)” to “ready to check” on my local.
To do this, we need some middleware, which is in the .NET library mentioned above as well.
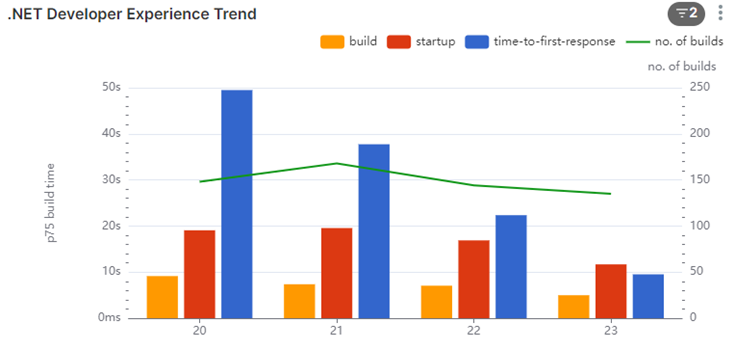
So now we have the full loop; let’s look at some data we collected:

Here’s one of our systems that takes 2-3 min to startup on an average day. We saw that there was an even higher number of 3min+ for the first request, so total waiting time of about 5 minutes. So we started to dig into why.
Before I mentioned the Web Browser “popping up,” this is the behavior on Visual Studio. Most of our engineers use Rider (or other JetBrains IDEs depending on their platform). When we looked into it, we found it wasn’t a huge load time of the first request; it was only taking about 20 seconds. What we found is that because JetBrains IDEs depended on the user opening the browser, the developer opens the browser minutes after it was ready. But why weren’t they opening it straight away? What was this other delay?
We were actually capturing another data point which proved valuable: it was the time the engineer context switches because they know it will take a few minutes, they go off and do something else.
The longer the compile and startup time, the longer they context switch (the bigger tasks they take on while waiting). It starts with checking email and Slack, to going and getting a coffee.
On some repos, we saw extreme examples of 15 to 20 min average for developers opening browsers on some days when the compile and startup time gets high. Probably a busy coffee machine on this day! 🙂
We had a look at some of our other repos that were faster:
In this one, we see that the startup is about 20-30 seconds (including compile time). The first request does take some time (we measured 5-10 seconds), but we are seeing about 30 seconds for the devs, so it’s unlikely they are context switching a lot.
We dug into this number some more though. We found most of the system owners weren’t context switching; they were waiting.
The people that were context switching were the contributors from other areas. We contacted a few of them to understand why. And they told us:
“I honestly didn’t expect it to be that fast, so after pressing debug, I would go make a coffee or do something else.”
To curb this behavior, we found that you can change Rider to pop up the browser, and by doing this, it would interrupt the devs’ context switch, and they would know it’s fast and hopefully change their behavior.
Conclusion
The F5 Experience highlights a critical aspect of developer productivity that often goes unmeasured and unoptimized. Through our investigation and data collection, we’ve uncovered several key insights:
- Compilation time alone doesn’t tell the whole story. The full cycle from pressing F5 to having a workable application can be significantly longer than expected.
- Developer behavior adapts to system performance. Slower systems lead to more context switching, which can further reduce productivity.
- Different IDEs and workflows can have unexpected impacts on the overall development experience.
- Even small changes, like automatically opening the browser in Rider, can have a positive impact on developer workflow.
By focusing on the F5 Experience, we can identify bottlenecks in the development process that might otherwise go unnoticed. This holistic approach to measuring and improving the development environment can lead to substantial gains in productivity and developer satisfaction.
Moving forward, teams should consider:
- Regularly measuring and monitoring their F5 Experience metrics
- Optimizing local development environments, including mocking or lightweight alternatives to production services
- Continuously seeking feedback from developers about their workflow and pain points
Remember, the goal is not just to have fast compile times, but to create a seamless, efficient development experience that allows developers to stay in their flow and deliver high-quality code more quickly.
By prioritizing the F5 Experience, we can create development environments that not only compile quickly but also support developers in doing their best work with minimal frustration and waiting. This investment in developer experience will pay dividends in increased productivity, better code quality, and happier development teams.
Anecdote
Another thing we were capturing with this data was information like machine architecture. We noticed 3 out of about 150 Engineers working on one of our larger repos had a compile time that was 3x the others, 3-4 minutes compare to a minute or so. We also noticed they had 7th gen vs the 9th gen intel’s that most fo the engineers had at the time, so we immediately connected out IT support to get them new laptops 🙂
