Swagger/Swashbuckle displaying Error with no information

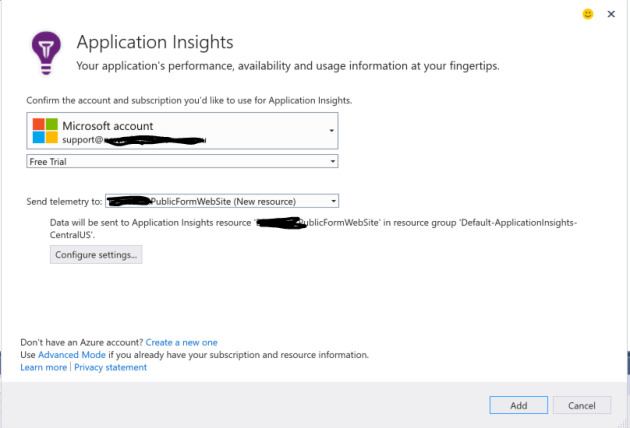
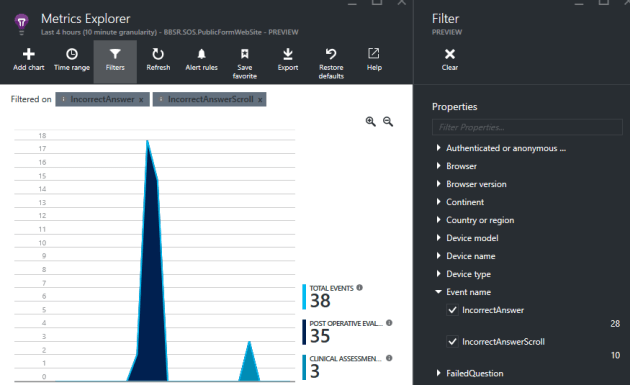
Ran into a interesting problem today when implementing swagger UI on one of our WebAPI 2 projects.

Locally it was working fine. But when the site was deployed to dev/test it would display an ambiguous error message

<Error>
<Message>An error has occurred.</Message>
</Error>

After hunting around I found that swashbuckle respects the customErrors mode in the system.web section of the web config.

Setting this Off displayed the real error, in our case a missing dependency

<system.web>
<customErrors mode="Off"/>
</system.web>


<Error>
<Message>An error has occurred.</Message>
<ExceptionMessage>
Could not find file 'C:\Octopus\Applications\Development\Oztix.GreenRoom.WebAPI\2.0.332.0\Oztix.GreenRoom.WebAPI.XML'.
</ExceptionMessage>
<ExceptionType>System.IO.FileNotFoundException</ExceptionType>
<StackTrace>
at System.IO.__Error.WinIOError(Int32 errorCode, String maybeFullPath) at System.IO.FileStream.Init(String path, FileMode mode, FileAccess access, Int32 rights, Boolean useRights, FileShare share, Int32 bufferSize, FileOptions options, SECURITY_ATTRIBUTES secAttrs, String msgPath, Boolean bFromProxy, Boolean useLongPath, Boolean checkHost) at System.IO.FileStream..ctor(String path, FileMode mode, FileAccess access, FileShare share, Int32 bufferSize, FileOptions options, String msgPath, Boolean bFromProxy) at System.IO.FileStream..ctor(String path, FileMode mode, FileAccess access, FileShare share, Int32 bufferSize) at System.Xml.XmlUrlResolver.GetEntity(Uri absoluteUri, String role, Type ofObjectToReturn) at System.Xml.XmlTextReaderImpl.OpenUrlDelegate(Object xmlResolver) at System.Threading.CompressedStack.runTryCode(Object userData) at System.Runtime.CompilerServices.RuntimeHelpers.ExecuteCodeWithGuaranteedCleanup(TryCode code, CleanupCode backoutCode, Object userData) at System.Threading.CompressedStack.Run(CompressedStack compressedStack, ContextCallback callback, Object state) at System.Xml.XmlTextReaderImpl.OpenUrl() at System.Xml.XmlTextReaderImpl.Read() at System.Xml.XPath.XPathDocument.LoadFromReader(XmlReader reader, XmlSpace space) at System.Xml.XPath.XPathDocument..ctor(String uri, XmlSpace space) at Swashbuckle.Application.SwaggerDocsConfig.<>c__DisplayClass8.<IncludeXmlComments>b__6() at Swashbuckle.Application.SwaggerDocsConfig.<GetSwaggerProvider>b__e(Func`1 factory) at System.Linq.Enumerable.WhereSelectListIterator`2.MoveNext() at Swashbuckle.Swagger.SwaggerGenerator.CreateOperation(ApiDescription apiDescription, SchemaRegistry schemaRegistry) at Swashbuckle.Swagger.SwaggerGenerator.CreatePathItem(IEnumerable`1 apiDescriptions, SchemaRegistry schemaRegistry) at System.Linq.Enumerable.ToDictionary[TSource,TKey,TElement](IEnumerable`1 source, Func`2 keySelector, Func`2 elementSelector, IEqualityComparer`1 comparer) at Swashbuckle.Swagger.SwaggerGenerator.GetSwagger(String rootUrl, String apiVersion) at Swashbuckle.Application.SwaggerDocsHandler.SendAsync(HttpRequestMessage request, CancellationToken cancellationToken) at System.Net.Http.HttpMessageInvoker.SendAsync(HttpRequestMessage request, CancellationToken cancellationToken) at System.Web.Http.Dispatcher.HttpRoutingDispatcher.SendAsync(HttpRequestMessage request, CancellationToken cancellationToken) at System.Web.Http.HttpServer.<SendAsync>d__0.MoveNext()
</StackTrace>
</Error>

Application Insights, and why you need them

Metrics are really important for decision making. To often in business I hear people make statements based on assumptions, followed by justifications like “It’s an educated guess”, if you want to get educated you should use metrics to get your facts first.

Microsoft recently published a great article (From Agile to DevOps at Microsoft Developer Division) about how they changed their agile processes, and one of the key things I took out of it was the change away from the product owner as the ultimate source of information.

A tacit assumption of Agile was that the Product Owner
was omniscient and could groom the backlog correctly…

… the Product Owner ranks the Product Backlog Items (PBIs) and these are treated more or less as requirements. They may be written as user stories, and they may be lightweight in form, but they have been decided.

We used to work this way, but we have since developed a more flexible and effective approach.In keeping with DevOps practices, we think of our PBIs as hypotheses. These hypotheses need to be turned into experiments that produce evidence to support or diminish the experiment, and that evidence in turn produces validated learning.

So you can use metrics to validate your hypotheses and make informed decision about the direction of your product.

If you are already in azure its easy and free for most small to mid-sized apps. You can do pretty similar things with google analytics too, but the reason i like the App Insights is it combines server side monitoring and also it works nicely with the Azure dashboard in the new portal, so i can keep everything in once place.

From Visual studio you can simply right click on a project and click “Add Application Insight Telemetry”

AddApplicaitonInsightsWebProject

This will bring up a wizard that will guide you through the process.

AddApplicaitonInsightsWizard1.PNG

One gotcha i found though was that because my account was linked to multiple subscriptions i had to cancel out of the wizard, then login with the server explorer then go through the wizard again.

It adds a lot of gear to your projects including

  • Javascript libraries
  • Http Module for tracking requests
  • Nuget packages for all the ApplicaitonInsights libraries
  • Application insights config file with the Key from your account

After that’s loaded in you’ll also need to add in tracking to various areas, the help pages in the azure interface have all the info for this and come complete with snippets you can easily copy and paste for a dozen languages and platforms (PHP, C#, Phyton, Javascript, etc) but not VB in a lot of instances which surprised me 🙂 you can use this link inside the Azure interface to get at all the goodies you’ll need

HelpAndCodeSnippetsApplicationInsights

Where I recommend adding tracking at a minimum is:

Global.ascx for web apps


public void Application_Error(object sender, EventArgs e)
{
// Code that runs when an unhandled error occurs

// Get the exception object.
Exception exc = Server.GetLastError;

log.Error(exc);
dynamic telemetry = new TelemetryClient();
telemetry.TrackException(exc);
Server.ClearError();

}

Client side tracking copy the snippet from their interface

Add to master page or shared template cshtml for MVC.

GetClientSideScriptCode


Also you should load it onto your VMs as well, there is a web platform installer you can run on your windows boxes that will load a service on for collecting the stats.

WebPlatformApplicationIsightInstaller

InstallApplicaitionInsightsWindowsServer

Warning though that the above needs a IISReset to complete. A good article on the setup is here.

For tracking events I normally create a helper class that wraps all my calls to make things easier.

Also as a lot of my apps these days are heavy JavaScript I’m using the tracking feature in JavaScript a lot more. The snippet they give you will create a appInsights object in the page you can reuse through your app after startup.

Below is an example drawn from code I put into a survey App recently, not exactly the same code but I will use this as an example. This is so we could track when a user answers a question incorrectly (i.e. validation fails), there is a good detailed article on this here

appInsights.trackEvent("AnswerValidationFailed",
{
SurveyName: "My Survey",
SurveyId: 22,
SurveyVersion: 3,
FailedQuestion: 261
});

By tracking this we can answer questions like

  • Are there particular questions that users fail to answer more often
  • Which surveys have a higher failure rate for data input

Now that you have the ability to ask these questions you can start to form hypotheses. For example i make make a statement like;

“I think Survey X is too complicated for users and needs to be split into multiple smaller surveys”

To validate this I could look at the metrics collected for the above event for the user error rate on survey X compare to other surveys and use this as a basis for my hypotheses. You can sue the metrics explorer to create charts that map this out for you, filtering by you event (example below)

MetricExplorerEventFilter

Then after the change is complete I can use the same metrics to measure the impact of my change.

This last point is another mistake I see in business a lot, too often changes is made, then no one reviews success. What Microsoft have done with their “Dev Ops” process embeds into their metrics into the process. So by default you are checking your facts before and after change, which is the right way to go about things imo.


TypeScript Project AppSettings

Ok so there’s a few nice things that MS have done with typescript, but Dev time vs build time vs deploy time they don’t all work the same, so there’s a few things we’ve done to make the F5 experience nice while making sure the build and deployed results are the same.

In the below examples we are using

  • Visual Studio 2015
  • Team City
  • Octopus Deploy

Firstly TypeScript in Visual Studio has this nice feature to wrap up your typescript into a single js file while your coding. It’ll save to this file as you are saving your TS files, so its nice for making code changes on the fly while debugging, and you get a single file output.

TypeScriptCombine

Also this will build when TeamCity runs msbuild as well. But don’t check this file in, its compile ts output, it should be treated like binary output from a C# project.

And you can further minify and compact this using npm (see this post for details).

This isn’t prefect though, because we shovel our static content to a separate CDN that is spared between environments (Folder per version), and we have environment specific JavaScript variables that need to be set, this can’t be done in a TypeScript file as they all compile into a single file. I could use npm to generate the TypeScript into 2 files but this conflicts too much with the developers local setup in using the above feature from my tests.

So we pulled it into a js file that is separate form the type script, this obviously though causes the type script to break as the object doesn’t exist. So we added a declaration file for it like below:

declare var AppSetting: {
url: string;
baseCredential: string;
ApiKey: string;
}

Then drop the actual object in a JavaScript file with the tokens ready for octopus, with a simple if statement to drop in the Developers local settings when running locally.


var AppSetting;
(function (AppSetting) {
if (window.location.hostname == "localhost") {
AppSetting.url= "http://localhost:9129/";
AppSetting.baseCredential= "XXXVVVWWW";
AppSetting.ApiKey= "82390189wuiuu";
} else {
AppSetting.url= "#{url}";
AppSetting.baseCredential= "#{baseCredential}";
AppSetting.ApiKey= "#{ApiKey}";
}
})(AppSetting || (AppSetting = {}));

This does mean we need a extra http request to pull down the appSetting js file for our environment, but it means we can maintain our single CDN for static content/code like we have traditionally done.

SQL Query Slow? Some Basic MSSQL tips

A lot of developers I’ve worked with in the past don’t have good experience with SQL out of the box, when is say good i mean beyond knowing the basics. A lot of the systems I work on are high performance so I end up training developers in SQL as a priority when they come onto the team. There is a few basic things I always show them which gets them up to speed pretty easily.

Common Mistakes to Avoid

Backwards Conversions in WHERE clauses

A common mistake is backwards where clauses, this causes the engine to create a temporary table and convert all the data in that column in the table, you should always convert the parameter not the column.


WHERE CONVERT(int,column1) = @param1

Cursors, they aren’t bad, just use them correctly

If you are using cursors for doing transactional workloads I will be scared and probably not talk to you again. If you are using them simply to iterate through a temporary table or table var and do “something” you are probably using them correctly.

Just remember the use these two hints all the time READ_ONLY and FAST_FORWARD, they will give you a speed boost of an order of magnitude.


DECLARE authors_cursor CURSOR READ_ONLY FAST_FORWARD FOR

limit them to a few thousand rows if you can, don’t use them for millions of rows if you can avoid it.

INSERT is your friend, UPDATE is your enemy

Try to design your schema with INSERTing rather than UDPATing, you will mitigate contention this way, contention of resources is what makes you build big indexes and will slow you down in the long run.

Get some CTEs up ya

Common Table Expressions (CTEs) are useful for breaking sub-queries out, and I find are cleaner in the code, performance difference is arguable though.

Table Variables over Temp Tables

Yes, I’ve said it, now I may get flamed. Temp tables have their place, primarily when you need to index your content, but if you have temporary data that is large enough to require an index, maybe it should be a real table.

Also Table variables are easier debugging because you don’t have to drop them before F5ing again in SSMS.

Missing Indexes

Number one cause of query slow down is bad indexing. If you are doing large amounts of UPDATE/INSERT on your tables though, too much indexing can be bad too.

SSMS is your friend in this case, there are a lot more advanced tools out there sure, but you should be starting with SSMS, you’ll be able to find out your basic slow downs

Look at query plans

Hit this button in the tool bar and your away

DisplayEstimatedQueryPlan

If there is an obvious slow down SSMS will recommend you an index to fix your problem.

You can see the below Green text it displays sometimes (not all the time) you can right click on this and select “Missing Index Details…” and it will give you are CREATE INDEX statement that you can use to create your index.

MissingIndexHintFromSSMS

Most of the index hints in here are pretty spot on but there is a few things to consider before going “yeah! here’s the index that will solve my problem”

  1. Don’t index bit columns, or columns that have a small Cardinality
  2. Look for covering indexes, what it suggests might be the same as an index you have already but with one extra column, which means you could use a single index for both jobs
  3. Think about any high volume updates you have, you might slow down your updating if you add more indexes

The query plan itself will give you some more detailed info than the hints

Each block will be broken up by the percent of the entire statement (below is 1 block which is 13% of the entire statement), then within each block it breaks it up further, the below 3 Index Seeks use 12% of the total performance each.

QueryPlanUISSMS

When looking at the above, it can get very confusing what to do if you are not very familiar with SQL this interface gives you a lot of info when you mouse over each point, I think this is why some developers like to hide behind entity frameworks 🙂

The basic thing i tell people to look out for is the below:

ClusterdIndexScan

Index Scans are usually your source of pain that you can fix, and when you get big ones SSMS will generally suggest indexes for you based on these. You will want to make sure they are consuming a fair chuck of the query before creating an index for them though, the above example of 2% is not a good one.

Maintain your Database

Your indexes will need defragmeting/rebuidling and you will need to reclaim space by backing up db and logs.

I won’t go into this too much in the scope of this post, I might do another post about it as its a rather large subject. I recommend googling this for recommendation but at least use the wizard in SSMS to setup a “default” maintenance plan job nightly, don’t leave your database un-maintained, that will slow it down in the long run.

People to watch and Learn from

Pinal Dave from SQL Authority is “the man”, he has come up on more of my google searches for SQL issues than stackoverflow.

Packaging Large Scale JS projects with gulp

Large scale JS projects have become a lot more common with the rise of AngularJS and other javascript frameworks.

Laying out your project though you want to have your source in a lot of separate files to keep things neat and in a structure, but you don’t want you browser making  a few hundred connections to the web server on every page load.

I previous blogged about a simple JS and CSS minify and compress for a C# based project, but this time I’m looking at a small AngularJS project that has over 50 js files.

I’m using VS 2015 with the Web Essentials add-on, so in the package.json file can put my npm requirements and they will download, with 2013 i previously had to run npm on my local each time I setup to get them, the new VS is way better for these tasks, if you haven’t upgraded to 2015 you should download it now.

There is 3 important files highlighted below

GulpPackageJsonBower.PNG

Firstly lets look at my package json file:

package.json

in here you can add all your npm dependencies and VS with run npm in the background to install them, as you are typing.

Next is the bower.json file

bower.sjon.png

This is used for managing your 3rd party libraries, traditionally when throwing in 3rd party js libraries I would use a CDN, however with Angular, you will end up with a bunch of smaller libraries that will end you up with too many CDN references, so you are better off using bower to download them into your project, then from there combine them (They will already be uglifyd in most cases).

Now there is also a “.bowerrc” file that i have added, because i don’t like the default path


{
"directory": "app/lib"
}

Again as with the package json it will start downloading these as you type and press save, also to note it doesn’t clean up if you delete one, so you’ll  need to go into the target location and delete the folder manually.

Lastly the Gulpfile.js file, here is where we bring it all together.

In the example below I am processing 2 lots of javascript, the 3rd party libraries into a lib.min.js and our code into scripts.min.js. I could also add a final step to combine them as well.

The good thing about the below is that as i add new js files to my /app/scripts folder, they automatically get combined into the main script file, and when a add new 3rd party libraries the will automatically get added to the 3rd party script file (hence the aforementioned change to the bowerrc file).

The 3rd party libraries tend to sometimes get painful though, you can see below that i am not minifing them only joining, the ones i’m using are all minified already, but sometimes you will get ones that aren’t, also one of the packages i am using contains the jQuery1.8 libraries that it appears to use for some sort of unit test, so i had to exclude this file specifically, so be prepared for some troubleshooting with this.


/// <binding BeforeBuild='clean' AfterBuild='minify, scripts' />
// include plug-ins
var gulp = require('gulp');
var concat = require('gulp-concat');
var uglify = require('gulp-uglify');
var del = require('del');
var rename = require('gulp-rename');
var minifyCss = require('gulp-minify-css');
var sourcemaps = require('gulp-sourcemaps');

gulp.task('default', function () {
});

//Define javascript files for processing
var config = {
AppJSsrc: ['App/Scripts/**/*.js'],
LibJSsrc: ['App/lib/**/*.min.js', '!App/lib/**/*.min.js.map',
'!App/lib/**/*.min.js.gzip', , 'App/lib/**/ui-router-tabs.js',
'!App/lib/**/jquery-1.8.2.min.js']
};

//delete the output file(s)
gulp.task('clean', function () {
del(['App/scripts.min.js']);
del(['App/lib.min.js']);
return del(['Content/*.min.css']);
});

gulp.task('scripts', function () {
// Process js from us
gulp.src(config.AppJSsrc)
.pipe(sourcemaps.init())
.pipe(uglify())
.pipe(concat('scripts.min.js'))
.pipe(sourcemaps.write('maps'))
.pipe(gulp.dest('App'));
// Process js from 3rd parties
gulp.src(config.LibJSsrc)
.pipe(concat('lib.min.js'))
.pipe(gulp.dest('App'));
});

gulp.task('minify', function () {
gulp.src('./Content/*.css')
.pipe(minifyCss())
.pipe(rename({
suffix: '.min'
}))
.pipe(gulp.dest('Content/'));
});

So now i end up with two files outputted

BuildOutputJavaScriptFiles.PNG

oh and don’t for get to add tehse fiels to your gitignore or tfignore so they don’t get checked in. and also make sure you add “note_modules” and your 3rd party library folder as well, you don’t want to be checking in your dependencies, I’ll do another blog post about using the above dependencies in the build environment.

Just to note, not having node_modules in my gitignore killed VS2015s integration with github causing a error about the path being longer than 260 characters. Prevented me checking in and refused to acknowledge the project was under source control.

And in my app i only need to script tags


<script src="App/lib.min.js"></script>
<script src="App/scripts.min.js"></script>

You will also note in the above processing I have a source map file output, this is essential for debugging the scripts. These map files wont get download unless the browser is in debugging mode and you should use your build/deployment environment to exclude from production, to stop people decompressing you js code.

You can see from the screen shot below with me debugging on my local, firebug is able to render the original javascript code for me to debug and step through the code just like it was uncompressed, with the original file names and all.

DebugFireFoxSourceMapFiles

Handling Client Side error in AngularJS and sending them Server Side

I did an example in my AzureDNS App today of how to add a ApiController that will log client side error to a server side store.

Coming from a C# background I am used to having a central logging store (e.g. SQL table or SEQ more recently) that all errors are dumped too. When running code on a server its easy for an app to throw its logs into something that is behind the firewall and catalogs the logs from all your apps nicely.

When you have code that is running in someone’s web browser that not always as easy, but what I’ve done with this example is just create a controller on /api/Log/Error within the running app that i can throw my JavaScript Exceptions at, then add a call from Angular’s global exception handler.

The Log Controller can be found here

https://github.com/HostedSolutions/AzureDNSUI/blob/master/src/HostedSol.AzureDNSUI.Web/Controllers/LogController.cs

The log error method is pretty straight forward, the logger object is passed in via DI from autofac


[Route("~/api/Log/Error")]
[HttpPost]
// POST: api/Log/Error
public void PostError([FromBody]string value)
{
_logger.Error(value);
}

The the global error handler in Angular is done as follows

https://github.com/HostedSolutions/AzureDNSUI/blob/master/src/HostedSol.AzureDNSUI.Web/App/Scripts/fac/loggerSvc.js


'use strict';
angular.module('AzureDNSUI') // This would be changed to your app name if reusing this code
.factory('$exceptionHandler', function($injector) {
return function(exception, cause) {
var $http = $injector.get("$http");
var $log = $injector.get("$log");
exception.message += ' (caused by "' + cause + '")';
$log.log(exception); // Logs to console
$http.post('/api/Log/Error', JSON.stringify(exception)); // Where the magic happens
throw exception;
};
});

An example error from Angular in our SEQ server below:

SEQExampleOutputFromAngularJS

There is a few fields that we can customize that I do by default from the Serilog config, some of these are not relevant for the javascript errors, for example the SourceContext will always be the same, I’ll do a follow-up post about collecting client information to pass through later.

Handling the Psychology of Users and Software Bugs

Users, when presented with issues in software (Error messages, unexpected behavior, etc), tend to try to explain things with what limited knowledge they have, and the lions share of users don’t understand the inner workings of software. Commonly this is know as Abductive reasoning, the processes of forming a conclusion based on the simplest possible explanation without much investigation.

Generally I find users draw conclusions in this manner from their past negative experience with your or other applications.

The first example I want to mention is relating users picking up on similar repeated error messages.

I used to expose the Message property of the Exception object in the error message to the users, in a hope to help in trouble shooting. This ended up causing a serious issues with the users reasoning.

As you may know one of the most common programming mistake in .NET is a “Object Reference not set to an instance of an object”, or null reference error. I once had a user say to me:

It’s been 6 months and we are still getting the same Object Reference Error coming back again, and again, when are you going to fix this Object reference error?

It was of course not the same error, when applying new development work I had made this common mistake and introduced a null reference error a few times. The user though saw the same error, even though it was in different section of the application, and assumed the same problem, most annoyed because it was the same issue he had already paid me 3 times to fix.

Similar unexpected behavior is another one.

I once had a web forms application where I didn’t take much care on the assignment of the default button in the panels, so the enter key had quite unpredictable behavior on some pages when used from textboxes, but it wasn’t until we had a user that didn’t like her mouse that we really started picking up on it.

At first we fixed a couple of pages, then she found more and more, after 3-4 reports of the issues (each on different pages) we realized it was wide spread, bit the bullet, and audited the whole application. Instead of fixing on a per report basis.

But this was enough, the user was poisoned, every time we spoke to her about issue she had she was sure it was “another problem with pressing the enter key”, 6 months later, she was still telling us “I think its another issues with pressing the enter key”.

This behavior of the user is unavoidable, you can’t change human behavior, but you can mitigate the behavior.

Firstly your Error Messages.

If you know what the error is, i.e. its a “handled error”, like your database server is offline/timing out. Then customize all your error messages in good English

A good error message should do two things

1. Tell the user whats wrong
2. Suggest what the user can do next

For example

If the exception you are handling is “SQLException: Timeout Exception”

The database is currently not responding, it maybe temporarily offline or there may be a larger issue. Please try again shortly and contact support if the problem persists.

Next if you have a global error handler like me, or are handling generic exceptions that you might not know what the error is, then be ambiguous and keep your user in the dark, don’t assume they can help you (They are not your friend 🙂 ).

A good error message in this situation is “Unknown Error”, tell the user you don’t know what it is, because you don’t or you would be handling it.

Unknown Error: Please contact support and quote them this number (44FHGI2)

How do you know what it is? Use a correlation ID, SharePoint is an example of this, but not a good one. In SharePoint when you get an error they give you an ID that you can pass on to the support team to lookup the logs, why share point is a bad example is that they use a GUID, have you every asked a user to read you a GUID over the phone?

CorrelationIDErrorMessage

If you ever have a reference number this long that people maybe reading or typing out make sure its got a check digit in it, and a damn good reason for it being so long.

If you don’t have some sort of sequence you can grab a number from, in your logging system or storage, then generating a fairly unique alpha-numeric code isn’t overly hard, lots of libraries out there. You should also feed your correlation Id into all logs form a users session if you can, not just the error.

Secondly Good Habits.

If someone picks up a mistake you’ve made (like my enter key example above) take some time to think, “How much of an issues is this going to be with the rest of my app?”, don’t let it get out of control, if you find some “bad practice” or even just “lazzyness”, take your time to check it out, Ctrl+Shitf+F is your friend in this circumstance. you can usually get a good indication from a few smart searches how wide spread an issue may or may not be.

Lastly, take some pride in your work.

A job finished isn’t always a job well done. I recommend giving yourself as much “click around time” as you can after your done (also know as exploratory testing if you need a fancy word to justify it to your boss), just clicking around and using it as much as you can, on all sorts of areas, don’t forget tabbing, enter keys, and the usual alternate methods of navigating around.