The Impact of Paved Paths and Embracing the Future of Development

Throughout this series, we’ve explored the concept of paved paths, from understanding the problems they solve to implementing them with practical tools like .NET templates. In this final post, we’ll examine the broader impact of paved paths on development culture and look towards the future of software development.

The Cultural Shift: Embracing Paved Paths

Implementing paved paths is more than just a technical change—it’s a cultural shift within an organisation. Let’s explore how paved paths influence various aspects of development culture:

1. Balancing Standardization and Innovation

Paved paths provide a standardized approach to development, but they’re not about enforcing rigid conformity. As David Heinemeier Hansson, creator of Ruby on Rails, aptly puts it:

“Structure liberates creativity. The right amount of standardization frees developers to focus on solving unique problems.”

Paved paths offer a foundation of best practices and proven patterns, allowing developers to focus their creative energy on solving business problems rather than reinventing the wheel for every new project.

2. Fostering Collaboration and Knowledge Sharing

With paved paths in place, developers across different teams and projects share a common language and set of tools. This commonality facilitates:

  • Easier code reviews across projects, everyone is following similar structure and standards
  • Simplified onboarding for new team members, you dont need to maintain a lot of onboarding docs yourselves, you can lean on centralized docs more
  • Increased ability for developers to contribute to different projects, the other projects in my company look kinda like mine

3. Continuous Improvement Culture

Paved paths are not static; they evolve with the organization’s needs and learnings. This aligns well with a culture of continuous improvement. As Jez Humble, co-author of “Continuous Delivery,” states:

“The only constant in software development is change. Your templates should evolve with your understanding.”

Regular reviews and updates to your paved paths can become a focal point for discussing and implementing improvements across your entire development process.

4. Empowering Developers

While paved paths provide a recommended route, they also empower developers to make informed decisions about when to deviate. This balance is crucial, as Gene Kim, author of “The Phoenix Project,” notes:

“The best standardized process is one that enables innovation, not stifles it.”

By providing a solid foundation, paved paths actually give developers more freedom to innovate where it matters most.

As we conclude our series, let’s consider how paved paths align with and support emerging trends in software development:

Microservices and Serverless Architectures: Paved paths can greatly simplify the creation and management of microservices or serverless functions. By providing templates and standards for these architectural patterns, organizations can ensure consistency and best practices across a distributed system.

DevOps and CI/CD: Paved paths naturally complement DevOps practices and CI/CD pipelines. They can include standard configurations for build processes, testing frameworks, and deployment strategies, ensuring that DevOps best practices are baked into every project from the start.

Cloud-Native Development: As more organisations move towards cloud-native development, paved paths can incorporate cloud-specific best practices, security configurations, and scalability patterns, primarily from Infrastructure-as-code. This can significantly reduce the learning curve for teams transitioning to cloud environments.

Platform Quality: I see a rise in use of tools like static code analysis to help encourage and educate engineers on internal practices and patterns, which work well with paved paths.

Conclusion: Embracing Paved Paths for Sustainable Development

As we’ve seen throughout this series, paved paths offer a powerful approach to addressing many of the challenges faced in modern software development. From breaking down monoliths to streamlining the creation of new services, paved paths provide a flexible yet standardized foundation for development.

By implementing paved paths, organizations can:

  1. Increase development speed without sacrificing quality
  2. Improve consistency across projects and teams
  3. Facilitate contribution cross system
  4. Empower developers to focus on innovation
  5. Adapt more quickly to new technologies and architectural patterns

However, it’s crucial to remember that paved paths are not a one-time implementation. They require ongoing maintenance, regular reviews, and a commitment to evolution. As Kelsey Hightower, Principal Developer Advocate at Google, reminds us:

“Best practices are not written in stone, but they are etched in experience.”

Your paved paths should grow and change with your organization’s experience and needs.

As you embark on your journey with paved paths, remember that the goal is not to restrict or control, but to enable and empower. By providing a clear, well-supported path forward, you free your teams to do what they do best: solve problems and create innovative solutions.

The future of software development is collaborative, adaptable, and built on a foundation of shared knowledge and best practices. Paved paths offer a way to embrace this future, creating a development environment that is both efficient and innovative. As you move forward, keep exploring, keep learning, and keep paving the way for better software development.

Measuring Product Health: Beyond Code Quality

In the world of software development, we often focus on code quality as the primary measure of a product’s health. While clean, efficient code with passing tests is crucial, it’s not the only factor that determines the success of a product. As a product engineer, it’s essential to look beyond the code and understand how to measure the overall health of your product. In this post, we’ll explore some key metrics and philosophies that can help you gain a more comprehensive view of your product’s performance and impact.

The “You Build It, You Run It” Philosophy

Before diving into specific metrics, it’s important to understand the philosophy that underpins effective product health measurement. We follow the principle of “You Build It, You Run It.” This approach empowers developers to take ownership of their products not just during development, but also in production. It creates a sense of responsibility and encourages a deeper understanding of how the product performs in real-world conditions.

What Can We Monitor?

When it comes to monitoring product health, there are several areas we usually focus on:

  1. Logs: Application, web server, and system logs
  2. Metrics: Performance indicators and user actions
  3. Application Events: State changes within the application

While all these are important, it’s crucial to understand the difference between logs and metrics, and when to use each.

The Top-Down View: What Does Your Application Do?

One of the most important questions to ask when measuring product health is: “What does my application do?” This top-down approach helps you focus on the core purpose of your product and how it delivers value to users. So ultimatelly when this value is impacted you know when to act.

Example: E-commerce Website

Let’s consider an e-commerce website. At its core, the primary function of such a site is to facilitate orders. That’s the ultimate goal – to guide users through the funnel to complete a purchase.

So, how do we use this for monitoring? We ask two key questions:

  1. Is the application successfully processing orders?
  2. How often should it be processing orders, and is it meeting that frequency right now?

How to Apply This?

To monitor this effectively, we generally look at 10-minute windows throughout the day (for example, 8:00 to 8:10 AM). For each window, we calculate the average number of orders for that same time slot on the same day of the week over the past four weeks. If the current number falls below this average, it triggers an alert.

This approach is more nuanced and effective than setting static thresholds. It naturally adapts to the ebb and flow of traffic throughout the day and week, reducing false alarms while still catching significant drops in performance. By using dynamic thresholds based on historical data, you’re less likely to get false positives during normally slow periods, yet you remain sensitive enough to catch meaningful declines in performance.

One of the key advantages of this method is that it avoids the pitfalls of static thresholds. With static thresholds, you often face a dangerous compromise. To avoid constant alerts during off-hours or naturally slow periods, you might set the threshold very low. However, this means you risk missing important issues during busier times. Our dynamic approach solves this problem by adjusting expectations based on historical patterns.

While we typically use 10-minute windows, you can adjust this based on your needs. For systems with lower volume, you might use hourly or even daily windows. This will make you respond to problems more slowly in these cases, but you’ll still catch significant issues. The flexibility allows you to tailor the system to your specific product and business needs.

Another Example: Help Desk Chat System

Let’s apply our core question – “What does this system DO?” – to a different type of application: a help desk chat system. This question is crucial because it forces us to step back from the technical details and focus on the fundamental purpose of the system adn teh value it delviers to the business and ultimately the customer.

So, what does a help desk chat system do? At its most basic level, it allows communication between support staff and customers. But let’s break that down further:

  1. It enables sending messages
  2. It displays these messages to the participants
  3. It presents a list of ongoing conversations

Now, you might be tempted to say that sending messages is the primary function, and you’d be partly right. But remember, we’re thinking about what the system DOES, not just how it does it.

With this in mind, how might we monitor the health of such a system? While tracking successful message sends is important, it might not tell the whole story, especially if message volume is low. We should also consider monitoring:

  • Successful page loads for the conversation list (Are users able to see their ongoing chats?)
  • Successful loads of the message window (Can users access the core chat interface?)
  • Successful resolution rate (Are chats leading to solved problems?)

By expanding our monitoring beyond just message sending, we get a more comprehensive view of whether the system is truly doing what it’s meant to do: helping customers solve their problems efficiently.

This example illustrates why it’s so important to always start with the question, “What does this system DO?” It guides us towards monitoring metrics that truly reflect the health and effectiveness of our product, rather than just its technical performance.

A 200 Ok response, is not always OK

As you consider your own systems, always begin with this fundamental question. It will lead you to insights about what you should be measuring and how you can ensure your product is truly serving its purpose.

The Bottom-Up View: How Does Your Application Work?

While the top-down view focuses on the end result, the bottom-up approach looks at the internal workings of your application. This includes metrics such as:

  • HTTP requests (response time, response code)
  • Database calls (response time, success rate)

Modern systems often collect these metrics through contactless telemetry, reducing the need for custom instrumentation.

Prioritizing Alerts: When to Wake Someone Up at 3 AM

A critical aspect of product health monitoring is knowing when to escalate issues. Ask yourself: Should the Network Operations Center (NOC) call you at 3 AM if a server has 100% CPU usage?

The answer is no – not if there’s no business impact. If your core business functions (like processing orders) are unaffected, it’s better to wait until the next day to address the issue.

Using Loss as a Currency for Prioritization

Once you’ve established a health metric for your system and can compare current performance against your 4-week average, you gain a powerful tool: the ability to quantify “loss” during a production incident. This concept of loss can become a valuable currency in your decision-making process, especially when it comes to prioritizing issues and allocating resources.

Imagine your e-commerce platform typically processes 1000 orders per hour during a specific time window, based on your 4-week average. During an incident, this drops to 600 orders. You can now quantify your loss: 400 orders per hour. If you know your average order value, you can even translate this into a monetary figure. This quantification of loss becomes your currency for making critical decisions.

With this loss quantified, you can now make more informed decisions about which issues to address first. This is where the concept of “loss as a currency” really comes into play. You can compare the impact of multiple ongoing issues, justify allocating more resources to high-impact problems, and make data-driven decisions about when it’s worth waking up engineers in the middle of the night.

Reid Hoffman, co-founder of LinkedIn, once said, “You won’t always know which fire to stamp out first. And if you try to put out every fire at once, you’ll only burn yourself out. That’s why entrepreneurs have to learn to let fires burn—and sometimes even very large fires.” This wisdom applies perfectly to our concept of using loss as a currency. Sometimes, you have to ask not which fire you should put out, but which fires you can afford to let burn. Your loss metric gives you a clear way to make these tough decisions.

This approach extends beyond just immediate incident response. You can use it to prioritize your backlog, make architectural decisions, or even guide your product roadmap. When you propose investments in system improvements or additional resources, you can now back these proposals with clear figures showing the potential loss you’re trying to mitigate, all be it with a pitch of crytal ball about how likely these incident are to occura gain sometimes.

By always thinking in terms of potential loss (or gain), you ensure that your team’s efforts are always aligned with what truly matters for your business and your users. You create a direct link between your technical decisions and your business outcomes, ensuring that every action you take is driving towards real, measurable impact.

Remember, the goal isn’t just to have systems that run smoothly from a technical perspective. It’s to have products that consistently deliver value to your users and meet your business objectives. Using loss as a currency helps you maintain this focus, even in the heat of incident response or the complexity of long-term planning.

In the end, this approach transforms the abstract concept of system health into a tangible, quantifiable metric that directly ties to your business’s bottom line.

Conclusion: A New Perspective on Product Health

As we’ve explored throughout this post, measuring product health goes far beyond monitoring code quality or individual system metrics. It requires a holistic approach that starts with a fundamental question: “What does our system DO?” This simple yet powerful query guides us toward understanding the true purpose of our products and how they deliver value to users.

By focusing on core business metrics that reflect this purpose, we can create dynamic monitoring systems that adapt to the natural ebbs and flows of our product usage. This approach, looking at performance in time windows compared to 4-week averages, allows us to catch significant issues without being overwhelmed by false alarms during slow periods.

Perhaps most importantly, we’ve introduced the concept of using “loss” as a currency for prioritization. This approach transforms abstract technical issues into tangible business impacts, allowing us to make informed decisions about where to focus our efforts. As Reid Hoffman wisely noted, we can’t put out every fire at once – we must learn which ones we can let burn. By quantifying the loss associated with each issue, we gain a powerful tool for making these crucial decisions.

This loss-as-currency mindset extends beyond incident response. It can guide our product roadmaps, inform our architectural decisions, and help us justify investments in system improvements. It creates a direct link between our technical work and our business outcomes, ensuring that every action we take drives towards real, measurable impact.

Remember, the ultimate goal isn’t just to have systems that run smoothly from a technical perspective. It’s to have products that consistently deliver value to our users and meet our business objectives.

As you apply these principles to your own systems, always start with that core question: “What does this system DO?” Let the answer guide your metrics, your monitoring, and your decision-making. In doing so, you’ll not only improve your product’s health but also ensure that your engineering efforts are always aligned with what truly matters for your business and your users.
No QA Environment!? Are You F’ING Crazy?

In the world of software development, we’ve long held onto the belief that a separate Quality Assurance (QA) or staging environment is essential for delivering reliable software. But what if I told you that this might not be the case anymore? Let’s explore why some modern development practices are challenging this conventional wisdom and how we can ensure quality without a dedicated QA environment.

Rethinking the Purpose of QA

Traditionally, QA environments have been used for various types of testing:

  • Integration Testing
  • Manual Testing (by developers)
  • Cross-browser Testing
  • Device Testing
  • Acceptance Testing
  • End-to-End Testing

But do we really need a separate environment for all of these? Let’s break it down.

The Pros and Cons of Mocks vs. End-to-End Testing

When we talk about testing, we often debate between using mocks and real systems. Both approaches have their merits and drawbacks.

Cons of Mocks

  • Need frequent updates to match new versions
  • May miss breaking changes that affect your system
  • Can’t guarantee full system compatibility

Cons of Real Systems (QA/Staging)

  • Not truly representative of production
  • Require maintenance
  • May lack proper alerting and monitoring
  • Often have less hardware, resulting in slower performance

As Cindy Sridharan, a testing engineer and blogger, puts it:

“I’m more and more convinced that staging environments are like mocks – at best a pale imitation of the genuine article and the worst form of confirmation bias. It’s still better than having nothing – but ‘works in staging’ is only one step better than ‘works on my machine’.”

Consumer-Driven Contract Testing: A Replacement for End-to-End Testing

Consumer-Driven Contract Testing (CDCT) is more than just a bridge between mocks and real systems – it’s a powerful approach that can effectively replace traditional end-to-end testing. This method allows for “distributed end-to-end tests” without the need for a full QA environment. Let’s explore how this process works in detail.

The CDCT Process

  1. Defining and Recording Pact Contracts
    • Consumers write tests that define their expectations of the provider’s API.
    • These tests generate “pacts” – JSON files that document the interactions between consumers and providers.
    • Pacts include details like HTTP method, path, headers, request body, and expected response.
  2. Using Mocks for Consumer-Side Testing
    • The generated pacts are used to create mock providers.
    • Consumers can now run their tests against these mocks, simulating the provider’s behavior.
    • This allows consumers to develop and test their code without needing the actual provider service.
  3. Publishing Contracts by API Consumers
    • Once generated and tested locally, these pact files are published to a shared location, often called a “Pact Broker”.
    • The Pact Broker serves as a central repository for all contracts in your system.
  4. Verifying Contracts in Provider Pipelines
    • Providers retrieve the relevant pacts from the Pact Broker.
    • They run these contracts against their actual implementation as part of their CI/CD pipeline.
    • This step ensures that the provider can meet all the expectations set by its consumers.
    • If a provider’s changes would break a consumer’s expectations, the pipeline fails, preventing the release of breaking changes.
  5. Continuous Verification
    • As both consumers and providers evolve, the process is repeated.
    • New or updated pacts are published and verified, ensuring ongoing compatibility.

How CDCT Replaces End-to-End Testing

Consumer-Driven Contract Testing (CDCT) changes the testing process by enabling teams to conduct testing independently of other systems. This approach allows developers to use mocks for testing, eliminating the need for a fully integrated environment and providing fast feedback early in the development process.

The key advantage of CDCT lies in its solution to the stale mock problem. The same pact contract that generates the mock also publishes a test that verifies the assumptions made in the mock. This test is then run on the backend system, ensuring that the mock remains an accurate representation of the actual service behavior.

As systems grow in complexity, CDCT proves to be more scalable and maintainable than traditional end-to-end testing. It covers the same ground as end-to-end tests but in a more modular way, basing scenarios on real consumer requirements. This approach not only eliminates environment dependencies but also ensures that testing reflects actual use cases, making it a powerful replacement for traditional end-to-end testing in modern development practices.

In my opinion, you need end to end test to verify a feature works. But we know end-to-end test are flakey, so pact is the only viable solution I have found that gives you the best of both worlds.

Dark Launching: Enabling UAT in Production

Dark launching is a powerful technique that allows development teams to conduct User Acceptance Testing (UAT) directly in the production environment, effectively eliminating the need for a separate QA environment for this purpose. Let’s explore how this works and why it’s beneficial.

Dark launching, also known as feature toggling or feature flags, involves deploying new features to production in a disabled state. These features can then be selectively enabled for specific users or groups, allowing for controlled testing in the real production environment.

By leveraging dark launching for UAT, development teams can confidently test new features in the most realistic environment possible – production itself. This approach not only removes the need for a separate QA environment but also provides more accurate testing results and faster time-to-market for new features. It’s a key practice in modern development that supports rapid iteration and high-quality software delivery.

But it takes me a long time to deploy to production, it’s much faster to deploy to QA, right?

Your production deployment should be as fast as QA; there’s no reason for it not to be. Normally if it is, you have a CI pipeline that isn’t optimized. Your CI should take less than 10 minutes…

The Ten-Minute Build: A Development Practice from Extreme Programming

Kent Beck, in “Extreme Programming Explained,” introduces the concept of the Ten-Minute Build. This practice emphasizes the importance of being able to automatically build the whole system and run all tests in ten minutes or less. If the build takes longer than ten minutes, everyone stops working and optimizes it until it takes less.

He also says: “Practices should lower stress. An automated build becomes a stress reliever at crunch-times. ‘Did we make a mistake? Let’s just build and see’.”

But I didn’t write my tests yet, so I don’t want to go to production yet…

Test-First Development: Building Confidence for Production Releases

In the realm of modern software development, Test-First Development practices such as Behavior-Driven Development (BDD) and Acceptance Test-Driven Development (ATDD) have emerged as powerful tools for building confidence in code quality.

At its core, Test-First Development involves writing tests before writing the actual code. This might seem counterintuitive at first, but it offers several advantages. By defining the expected behavior upfront, developers gain a clear understanding of what the code needs to accomplish. This clarity helps in writing more focused, efficient code that directly addresses the requirements.

The power of these Test-First Development practices lies in their ability to instill confidence in the code from the very beginning. As developers write code to pass these predefined tests, they’re essentially building in quality from the ground up. This approach shifts the focus from finding bugs after development to preventing them during development.

By embracing Test-First Development, it will not only enhance your development process but makes practices like dark launching safe for UAT.

When to Use (and Not Use) Dark Launching

Dark launching is great for:

  • Showing feature progress to designers or Product Owners
  • Allowing stakeholders to use incremental UI changes

However, it’s not suitable for manual testing. Your automated tests should give you confidence in your changes.

Addressing Cross-Browser Testing

Cross-browser testing can be handled through automation tools like Playwright or by using local environments for fine-tuning and inspection.

The Case for Eliminating QA Environments

What I find most commonly is engineers who can’t run their systems locally. If this is the case for you, in order to see your changes, you need to wait for a CI pipeline and deployment to QA. This means your inner loop of development includes CI, and this will slow you down A LOT.

Our goal is to make the inner loop of development fast. QA environments, in my experience, are a crutch that engineers use to support a broken local developer experience. By taking them away, it forces people to fix the local experience and keep their production pipeline lean and fast, both things we want.

While it might be tempting to keep a QA environment “just in case,” this can lead to falling back into old habits.

Conclusion

Embracing modern development practices without a QA environment might seem daunting at first, but it can lead to faster, more reliable software delivery. By focusing on practices like consumer-driven contract testing, dark launching, and test-first development, teams can ensure quality without the overhead of maintaining a separate QA environment. Remember, as with any significant change, it requires commitment and a willingness to break old habits. But the rewards – in terms of efficiency, quality, and speed – can be substantial.

The F5 Experience (Testing)

Part of the F5 Experience is also running tests. Can I open my IDE and “just run the tests” after cloning a project?

Unit tests generally yes, but pretty much every other kind of test that engineers create these days (UI, Integration, end-to-end, etc.) needs complex environments managed either manually, or spawned in Kubernetes or a Docker Compose that brings your laptop to a crawl when running.

End-to-end tests I’ll leave for another day, and focus mainly on the ones with fewer hops such as UI and integration tests.

So what’s the problem here? The problem is if tests are hard to run, people won’t run them locally. They’ll wait for CI, and CI then becomes a part of the inner loop of development. You rely on it for dev feedback for code changes locally.

Even the best CI pipelines are looking at at least 5-10 minutes, the average ones even longer. So if you have to wait 10-15 minutes to validate your code changes are OK, then it’s going to make you less effective. You want the ability to run the test locally to get feedback in seconds.

Let’s first measure the problem. Below are open-source repos for Jest, Vitest, NUnit, and xUnit collectors:

These allow us to fire the data at an ingestion endpoint to get it to our Hadoop. They can be reused as well by anyone that sets up an endpoint and ingests the data.

They will also send from CI, using the username of the person that triggered the build when running in CI and the logged-in user from the engineer’s local. This allows us to compare who is triggering builds that run tests vs. if they are running on their locals.

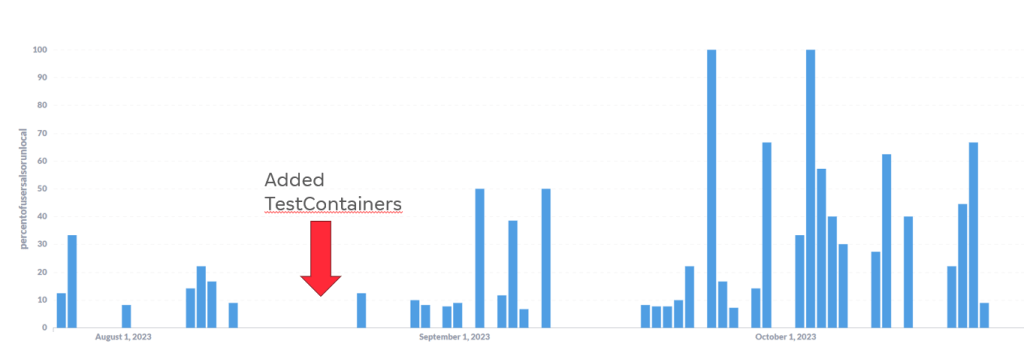
Looking into this data on one of our larger repos, we found that there was a very low number of users running the integration tests locally, so it was a good candidate for experimentation.

When looking at the local experience, we found a readme with several command-line steps that needed to be run in order to spin up a Docker environment that worked. Also, the steps for local and CI were different, which was concerning, as this means that you may end up with tests that fail on CI but you can’t replicate locally.

Looking at this with one of my engineers, he suggested we try Testcontainers to solve the problem.

So we set up the project with Testcontainers to replace the Docker Compose.

The integration tests would now appear and be runnable in the IDE, the same as the unit tests. So we come back to our zero setup goal of the F5 Experience, and we are winning.

Also, instead of multiple command lines, you can now run dotnet test and everything is orchestrated for you (which is what the IDE does internally). Some unreliable “waits” in the Docker Compose were able to be removed because the Testcontainers orchestration takes care of this, knowing when containers are ready and able to be used (such as databases, etc.).

It did take a bit of time for our engineers to get used to it, but we can see over time the percentage of engineers running CI vs. Local is increasing, meaning our inner loop is getting faster.

Conclusion

The F5 Experience in testing is crucial for maintaining a fast and efficient development cycle. By focusing on making tests easy to run locally, we’ve seen significant improvements in our team’s productivity and the quality of our code.

Key takeaways from our experience include:

  1. Measure First: By collecting data on test runs, both in CI and locally, we were able to identify areas for improvement and track our progress over time.
  2. Simplify the Setup: Using tools like Testcontainers allowed us to streamline the process of running integration tests, making it as simple as running unit tests.
  3. Consistency is Key: Ensuring that the local and CI environments are as similar as possible helps prevent discrepancies and increases confidence in local test results.
  4. Automation Matters: Removing manual steps and unreliable waits not only saves time but also reduces frustration and potential for errors.

The journey to improve the F5 Experience in testing is ongoing. As we continue to refine our processes and tools, we should keep in mind that the ultimate goal is to empower our engineers to work more efficiently and confidently. This means constantly evaluating our testing practices and being open to new technologies and methodologies that can further streamline our workflow.

Remember, the ability to quickly and reliably run tests locally is not just about speed—it’s about maintaining the flow of development, catching issues early, and fostering a culture of quality. As we’ve seen, investments in this area can lead to tangible improvements in how our team works and the software we produce.

Let’s continue to prioritize the F5 Experience in our development practices, always striving to make it easier and faster for our engineers to write, test, and deploy high-quality code.

System Building Manifesto 

It’s hard for highly technical people to not dominate conversations about tech. But in a role of Engineering Manager it’s important to not do this, ownership should be with the people doing the work not their managers.

So how do you manage people with less experience than you and not become a dictator?

Something I’ve been working on with my teams lately is coming up with High level Guidelines to give them work with. Highlighting common pit falls and encouraging best practice that come from the experienced people in the organisation. Having a common understanding of what’s good or best help people move in the right direction while giving them the freedom to design and build as they like, as long as the guidelines are not too specific and leave room for interpretation that maybe be slightly with each team or engineers individual context.

For example, I would not give my teams a guideline of “Code Coverage >80%”, this is too specific, and based on a team’s application they are working on they maybe happy with 70 or even 60%, and that’s ok. A better way to phrase this if coverage is important to you would be “Team’s should value and have high test coverage”.

This again though is too specific, If you have poor assertions, it doesn’t matter what % coverage you have right? Code coverage has a higher purpose, and it alone does not serve this purpose, it’s better to focus on the higher level goals.

Code Coverage, for me, is a part of Test Automation, the goal of test automation is to reduce bugs, production issues etc. So these in my opinion are better to focus on. In my example below

Systems should have test automation that brings confidence and inspires courage in engineers

Where I mention test automation i mention the behaviour I have seen in high performing teams specifically. I’ve worked in teams where the “deploy” button is pressed with little regard for the impacts, because the Engineers are confident in the pipelines, monitoring and rollbacks that are in place. This for me is the high level goal i want my engineers to strive for, Real Continuous Delivery.

So here’s the full list I have in Draft, feel free to comment, I’ll do some follow up post with dives into some of them.

I used the word “Manifesto” because when i showed them to another manager it’s what he called it, I thought it was cool 🙂

Guiding principles for Systems

  • Systems should be Domain Specific, responsible for one or few domains
  • Systems should be small in the overwhelming majority of cases. Small systems limit complexity
  • Systems should be consistent in design in the overwhelming majority of cases
  • Systems should be easy to build
  • Systems should have test automation that brings confidence and inspires courage in engineers
  • Systems should be easy to contribute to, not require extensive training
  • Systems should have Cross Cutting concerns addressed and shared in an easy and consistent way
  • Systems operate independently for the purpose of testing and debugging
  • Systems have consistent agreed upon telemetry for monitoring
    • Telemetry is a solved cross cutting concern for non-domain specific metrics
  • Systems are built on Modern up-to-date frameworks and platforms
  • Systems use Continuous Integration as a principle not a tool, merge and deploy often and in small increments
  • A System scales horizontally, both within a site and across multiple site. With this comes redundancy, Users experience zero downtime for instance and site outages
  • Systems have owners, who are responsible for the long-term health of the systems and who have contributors as customers

Build System integration with Environment Variables

Different CI systems expose a variety of an array of information in environment variables for you to access, for example commit hash, branch, etc which is handy if you are writing CI tooling. Some of them even seek to standardize these conventions.

This post is primarily about collating that info into a single source for lookup. Ideally if you are writing tooling that you want a lot of people use you should support multiple CI systems to increase adoption.

As we look at each the first thing we need to do is tell which system is running, each CI platform has a convention to allow you to do this that we’ll talk about first

Below is a table of each Major build system and example bash of how to detect that the process is running in them, as a well as link to documentation on Env Vars that the system exposes.

Jenkins“$JENKINS_URL” != “”
Travis“$CI” = “true”
“$TRAVIS” = “true”
AWS Codebuild“$CODEBUILD_CI” = “true”
Teamcity“$TEAMCITY_VERSION” != “”
Circle CI“$CI” = “true”
“$CIRCLECI” = “true”
Semaphore CI“$CI” = “true”
“$SEMAPHORE” = “true”
Drone CI“$CI” = “drone”
“$DRONE” = “true”
Heroku“$CI” = “true”
“$HEROKU_TEST_RUN_BRANCH” != “”
Appveyor CI“$CI” = “true” || “$CI” = “True”
“$APPVEYOR” = “true” || “$APPVEYOR” = “True”
Gitlab CI“$GITLAB_CI” != “”
Github Actions“$GITHUB_ACTIONS” != “”
Azure Pipelines“$SYSTEM_TEAMFOUNDATIONSERVERURI” != “”
Bitbucket“$CI” = “true”
“$BITBUCKET_BUILD_NUMBER” != “”

Below is 4 commonly used Parameters as an example, there are much more available, but as you can see form this list there is a lot of commonality.

Build SystembranchcommitPR #Build ID
JenkinsghprbSourceBranch
GIT_BRANCH
BRANCH_NAME
ghprbActualCommit
GIT_COMMIT
ghprbPullId
CHANGE_ID
BUILD_NUMBER
Travis TRAVIS_BRANCHTRAVIS_PULL_REQUEST_SHATRAVIS_PULL_REQUESTTRAVIS_JOB_NUMBER
AWS CodebuildCODEBUILD_WEBHOOK_HEAD_REFCODEBUILD_RESOLVED_SOURCE_VERSIONCODEBUILD_SOURCE_VERSIONCODEBUILD_BUILD_ID
Teamcity BUILD_VCS_NUMBERTEAMCITY_BUILD_ID
Circle CI CIRCLE_BRANCHCIRCLE_SHA1CIRCLE_PULL_REQUESTCIRCLE_BUILD_NUM
Semaphore CI SEMAPHORE_GIT_BRANCHREVISIONPULL_REQUEST_NUMBERSEMAPHORE_WORKFLOW_NUMBER
Drone CI DRONE_BRANCHDRONE_PULL_REQUESTDRONE_BUILD_NUMBER
Heroku HEROKU_TEST_RUN_BRANCHHEROKU_TEST_RUN_COMMIT_VERSIONHEROKU_TEST_RUN_ID
Appveyor CI APPVEYOR_REPO_BRANCHAPPVEYOR_REPO_COMMITAPPVEYOR_PULL_REQUEST_NUMBERAPPVEYOR_JOB_ID
Gitlab CI CI_BUILD_REF_NAME
CI_COMMIT_REF_NAME
CI_BUILD_REF
CI_COMMIT_SHA
CI_BUILD_ID
CI_JOB_ID
Github Actions GITHUB_REFGITHUB_SHAcan get from RefGITHUB_RUN_ID
Azure Pipelines BUILD_SOURCEBRANCHBUILD_SOURCEVERSIONSYSTEM_PULLREQUEST_PULLREQUESTID
SYSTEM_PULLREQUEST_PULLREQUESTNUMBER
BUILD_BUILDID
Bitbucket BITBUCKET_BRANCHBITBUCKET_COMMITBITBUCKET_PR_IDBITBUCKET_BUILD_NUMBER

For Teamcity a common work around to it’s lack of env vars is to place a root level set of parameters that will inherit to every config on the server

example

env.TEAMCITY_BUILD_BRANCH = %teamcity.build.branch%
env.TEAMCITY_BUILD_ID = %teamcity.build.id%
env.TEAMCITY_BUILD_URL = %teamcity.serverUrl%/viewLog.html?buildId=%teamcity.build.id%
env.TEAMCITY_BUILD_COMMIT = %system.build.vcs.number%

Sonarqube with a MultiLanguage Project, TypeScript and dotnet

Sonarqube is a cool tool, but getting multiple languages to work with it can be hard, especially because each language has its own plugin maintained by different people most of the time, so the implementations are different, so for each language you need to learn a new sonar plugin.

In our example we have a frontend project using React/Typescript and dotnet for the backend.

For C# we use the standard ootb rules from microsoft, plus some of our own custom rules.

For typescript we follow a lot of recommendations from AirBnB but have some of our own tweaks to it.

In the example I am using an end to end build in series, but in reality we use build chains to speed things up so our actual solution is quite more complex than this.

So the build steps look something like this

  1. dotnet restore
  2. Dotnet test, bootstrapped with dotcover
  3. Yarn install
  4. tslint
  5. yarn test
  6. Sonarqube runner

Note: In this setup we do not get the Build Test stats in Teamcity though, so we cannot block builds for test coverage metrics.

So lets cover the dotnet side first, I mentioned our custom rules, I’ll do a separate blog post about getting them into sonar and just cover the build setup in this post.

with the dotnet restore setup is pretty simple, we do use a custom nuget.config file for our internal nuget server, i would recommend always using a custom nuget config file, your IDEs will pick this up and use its settings.


dotnet restore --configfile=%teamcity.build.workingDir%\nuget.config MyCompany.MyProject.sln

The dotnet test step is a little tricky, we need to boot strap it with dotcover.exe, using the analyse command and output HTML format that sonar will consume (yes, sonar wants the HTML format).


%teamcity.tool.JetBrains.dotCover.CommandLineTools.DEFAULT%\dotcover.exe analyse /TargetExecutable="C:\Program Files\dotnet\dotnet.exe" /TargetArguments="test MyCompany.MyProject.sln" /AttributeFilters="+:MyCompany.MyProject.*" /Output="dotCover.htm" /ReportType="HTML" /TargetWorkingDir=.

echo "this is working"

Lastly sometimes the error code on failing tests is non zero, this causes the build to fail, so by putting the second echo line here it mitigates this.

Typescript We have 3 steps.

yarn install, which just call that exact command

Out tslint step is a command line step below, again we need to use a second echo step because when there is linting errors it returns a non zero exit code and we need to process to still continue.


node ".\node_modules\tslint\bin\tslint" -o issues.json -p "tsconfig.json" -t json -c "tslint.json" -e **/*.spec.tsx -e **/*.spec.ts
echo "this is working"

This will generate an lcov report, now i need to put a disclaimer here, lcov has a problem where it only reports coverage on the files that where executed during the test, so if you have code that is never touched by tests they will not appear on your lcov report, sonarqube will give you the correct numbers. So if you get to the end and find that sonar is reporting numbers a lot lower than what you thought you had this is probably why.

Our test step just run yarn test, but here is the fill command in the package json for reference.

"scripts": {
"test": "jest –silent –coverage"
}

Now we have 3 artifacts, two coverage reports and a tslint report.

The final step takes these, runs an analysis on our C# code, then uploads everything

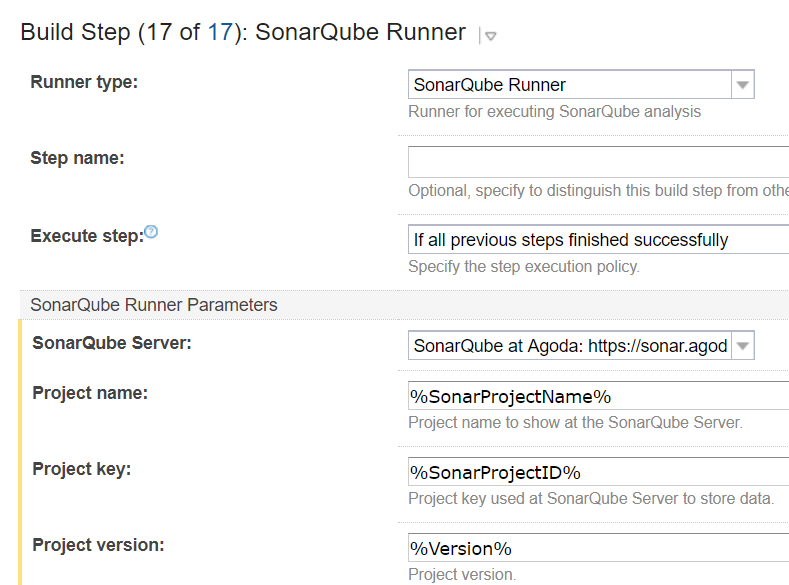
We use the sonarqube runner plugin from sonarsource

SonarqubeRunnerTeamCityTypeScriptDotnet

The important thing here is the additional Parameters that are below

-Dsonar.cs.dotcover.reportsPaths=dotCover.htm
-Dsonar.exclusions=**/node_modules/**,**/dev/**,**/*.js,**/*.vb,**/*.css,**/*.scss,**/*.spec.tsx,**/*.spec.ts
-Dsonar.ts.coverage.lcovReportPath=coverage/lcov.info
-Dsonar.ts.excludetypedefinitionfiles=true
-Dsonar.ts.tslint.outputPath=issues.json
-Dsonar.verbose=true

You can see our 3 artifacts that we pass is, we also disable the typescript analysis and rely on our analysis from tslint. The reason for this is it allows us to control the analysis from the IDE, and keep the analysis that is done on the IDE easily in sync with the Sonarqube server.

Also if you are using custom tslint rules that aren’t in the sonarqube default list you will need to import them, I will do another blog post about how we did this in bulk for the 3-4 rule sets we use.

Sonarqube without a language parameter will auto detect the languages, so we exclude files like scss to prevent it from processing those rules.

This isn’t needed for C# though because we use the nuget packages, i will do another blog post about sharing rules around.

And that’s it, you processing should work and turn out something like the below. You can see in the top right both C# and Typescript lines of code are reported, so this reports Bugs, code smells, coverage, etc is the combined values of both languages in the project.

SonarqubeCodeCoverageStaticAnalysisMultiLanguage

Happy coding!

Comparing Webpack Bundle Size Changes on Pull Requests as a Part of CI

We’ve had some issues where developers haven’t realized it and inadvertently increased the size of our bundles in work they have been doing. So we tried to give them more visibility of the impact of their change on the Pull Request, but using webpack stats, and publishing a compare to the PR for them.

The first part of the is getting webpack-stats-plugin into the solution and also I’ve done a custom version of webpack-compare to output mark down, and only focus on the files you have changed instead of all of them.


"webpack-compare-markdown": "dicko2/webpack-compare",
"webpack-stats-plugin": "0.1.5"

Then we add yarn commands into the package json to preform the work of generating and comparing the stats files


"analyze": "webpack --profile --json > stats.json",
"compare": "webpack-compare-markdown stats.json stats-new.json -o compare"

But what are we comparing? Here’s where it gets a bit tricky. We need to be able to compare the latest master, so what I did was, when the build config that runs the compare runs on master branch I generate a nuget package and push it up to our local server, this way I can just get latest version of this package to get the master stats file.


if("%teamcity.build.branch%" -eq "master")
{
md pack
copy-item stats.json pack

$nuspec = '<?xml version="1.0" encoding="utf-8"?>
<package xmlns="http://schemas.microsoft.com/packaging/2010/07/nuspec.xsd">
<metadata>
<!-- Required elements-->
<id>ClientSide.WebPackStats</id>
<version>$Version$</version>
<description>Webpack stats file from master builds</description>
<authors>Dicko</authors>
</metadata>
<files>
<file src="stats.json" target="tools" />
</files>
</package>'

$nuspec >> "pack\ClientSide.WebPackStats.nuspec"
cd pack
%teamcity.tool.NuGet.CommandLine.DEFAULT%\tools\nuget.exe pack -Version %Version%
%teamcity.tool.NuGet.CommandLine.DEFAULT%\tools\nuget.exe push *.nupkg -source https://lib-mynuget.io/api/odata -apiKey "%KlondikeApiKey%"
}

If we are on a non-master branch we need to download the nuget and run the compare to generate the report.


if("%teamcity.build.branch%" -ne "master")
{
%teamcity.tool.NuGet.CommandLine.DEFAULT%\tools\nuget.exe install ClientSide.WebPackStats
$dir = (Get-ChildItem . -Directory -Filter "ClientSide.WebPackStats*").Name
move-item stats.json stats-new.json
copy-item "$dir\tools\stats.json" stats.json
yarn compare
}

Then finally we need to comment back to the github pull request with the report


&nbsp;

#======================================================
$myRepoURL = "%myRepoURL%"
$GithubToken="%GithubToken%"
#======================================================
$githubheaders = @{"Authorization"="token $GithubToken"}
$PRNumber= ("%teamcity.build.branch%").Replace("pull/","")

$PathToMD ="compare\index.MD"

if("%teamcity.build.branch%" -ne "master")
{

function GetCommentsFromaPR()
{
Param([string]$CommentsURL)

$coms=invoke-webrequest $CommentsURL -Headers $githubheaders -UseBasicParsing
$coms=$coms | ConvertFrom-Json
$rtnGetCommentsFromaPR = New-Object System.Collections.ArrayList

foreach ($comment in $coms)
{
$info1 = New-Object System.Object
$info1 | Add-Member -type NoteProperty -name ID -Value $comment.id
$info1 | Add-Member -type NoteProperty -name Created -Value $comment.created_at
$info1 | Add-Member -type NoteProperty -name Body -Value $comment.Body
$i =$rtnGetCommentsFromaPR.Add($info1)
}
return $rtnGetCommentsFromaPR;
}

$pr=invoke-webrequest "$myRepoURL/pulls/$PRNumber" -Headers $githubheaders -UseBasicParsing
$pr=$pr.Content | ConvertFrom-Json

$pr.comments_url
$CommentsFromaPR= GetCommentsFromaPR($pr.comments_url)
$commentId=0
foreach($comment in $CommentsFromaPR)
{
if($comment.Body.StartsWith("[Webpack Stats]"))
{
Write-Host "Found an existing comment ID " + $comment.ID
$commentId=$comment.ID
}
}
$Body = [IO.File]::ReadAllText($PathToMD) -replace "`r`n", "`n"
$Body ="[Webpack Stats] `n" + $Body
$Body

$newComment = New-Object System.Object
$newComment | Add-Member -type NoteProperty -name body -Value $Body

&nbsp;

if($commentId -eq 0)
{
Write-Host "Create a comment"
#POST /repos/:owner/:repo/issues/:number/comments
"$myRepoURL/issues/$PRNumber/comments"
invoke-webrequest "$myRepoURL/issues/$PRNumber/comments" -Headers $githubheaders -UseBasicParsing -Method POST -Body ($newComment | ConvertTo-Json)
}
else
{
Write-Host "Edit a comment"
#PATCH /repos/:owner/:repo/issues/comments/:id
"$myRepoURL/issues/$PRNumber/comments/$commentId"
invoke-webrequest "$myRepoURL/issues/comments/$commentId" -Headers $githubheaders -UseBasicParsing -Method PATCH -Body ($newComment | ConvertTo-Json)
}

}

&nbsp;

And we are done, below is what the output looks like in GitHub

WebpackBundleSizeChangeOnPullRequestBuild

Happy packing!

Slack Bots – Merge Queue Bot

I recently did a talk about a Slack Bot we created to solve our issue of merging to master. Supaket Wongkampoo helped me out with the Thai translation on this one.

We have over 100 developers working on a single repository, so at any one time we have 20 odd people wanting to merge, and each need to wait for a build to complete in order to merge, then one merged the next person must get those changes and rerun. It quit a common scenario but I haven’t seen any projects doing this with this much frequency.

Slides are available here https://github.com/tech-at-agoda/meetup-2017-04-01


GitHub Pull Request Merge Ref and TeamCity CI fail

GitHub has an awesome feature that allows us to build on the potential merge result of a pull request.

This allows us to run unit and UI tests against the result of a merge, so we know with certainty that it works, before we merge the code.

To get this working with TeamCity is a pain in the ass though.

Lets look at a basic workflow with this:

First we will look at two active pull request, and we are about to merge

MasterFeatureBranchGitHubFlow

Pull request 2 advertises the /head (actual branch) and /merge (result “if we merged”)

TeamCity say you should tie your builds to the /merge for CI, this will build the merge result, and I agree.

However lets look at what happens in GitHub when we merge in Feature 1.

MasterFeatureBranchGitHubFlowMergedFeature1

The new code goes into master, which will recalculate the merge result on Pull request 2. TeamCity correctly builds the merge reference and validates that the Pull Request will succeed.

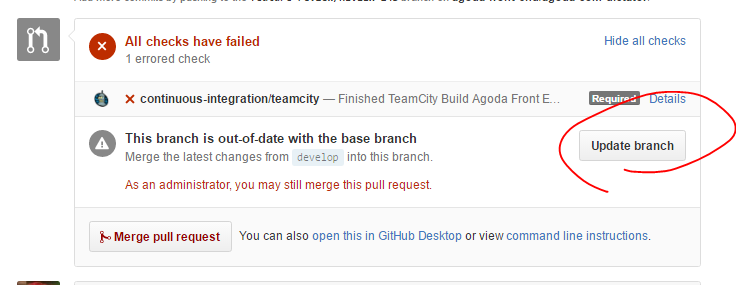
However if we look in GitHub we will see the below

UpdateGitHubBranch

It now blocks you and prompts you to updates your branch.

After you click this, the /head and /merge refs will update, as it adds a commit to your branch and recalculates the merge result again, then you need wait for another build to validate the new commit on your branch.

MergeAndHeadRefOnGitHubBranchUpdate

This now triggers a second build.And when it completes you can merge.

The issues here is we are double building. There is two solutions as I see it,

  1. GitHub should allow you top merge without updating your branch
  2. TeamCity should allow you to trigger from one ref and build on a different one

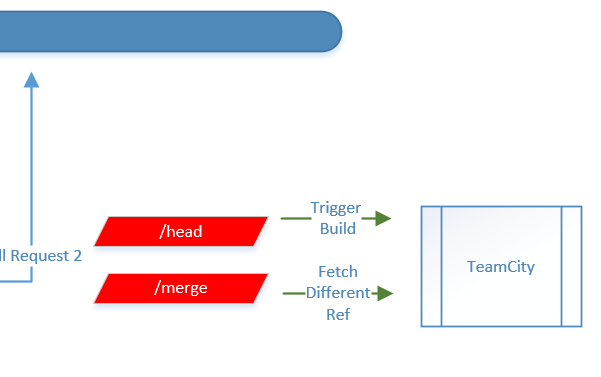
I was able to implement the second result using a build configuration that calls the TeamCity API to trigger a build. However my preference would be number 1 as this is more automated.

BuildOffDifferentBranchFromTrigger

Inside it looks like this

BuildOffDifferentBranchFromTrigger1

Below is example powershell that is used in the trigger build, we had an issue with the SSL cert (even though it wasn’t self signed) so had to disable the check for it to work.

add-type @"
using System.Net;
using System.Security.Cryptography.X509Certificates;
public class TrustAllCertsPolicy : ICertificatePolicy {
public bool CheckValidationResult(
ServicePoint srvPoint, X509Certificate certificate,
WebRequest request, int certificateProblem) {
return true;
}
}
"@
[System.Net.ServicePointManager]::CertificatePolicy = New-Object TrustAllCertsPolicy

$buildBranch ="%teamcity.build.branch%"
Write-Host $buildBranch
$buildBranch = $buildBranch.Replace("/head","/merge")
$postbody = "<build branchName='$buildBranch'>
<buildType id='%TargetBuildType%'/>
</build>"
Write-Host $postbody
$user = '%TeamCityUser%'
$pass = '%TeamCityPassword%'

$secpasswd = ConvertTo-SecureString $pass -AsPlainText -Force
$credential = New-Object System.Management.Automation.PSCredential($user, $secpasswd)

Invoke-RestMethod https://teamcity/httpAuth/app/rest/buildQueue -Method POST -Body $postbody -Credential $credential -Headers @{"accept"="application/xml";"Content-Type"="application/xml"}

You will see that we replace the branch name head with merge, so we trigger after someone clicks the update branch button only.

Also don’t forget to add a VCS trigger for file changes “+:.”, so that it will only run builds when there are changes.

VCSTriggerRule

We are running with this solution this week and I am going to put a request into GitHub support about option 1.

This is a really big issues for us as we have 30-40 open pull requests on our repo, so double building creates a LOT of traffic.

If anyone has a better solution please leave some comments.